Potholes and fallen trees – the road ahead

Earlier this year (May 2015) we had an election here in the UK so it seems appropriate to try and scout out what may lay ahead, based on the budget statement, the business secretary Sajid Javid’s speech on productivity, and Jo Johnson’s speech to universities UK.

While there are some aspects that I agree with there are others where their impact very much depends on the detail of its implementation. Overall, there is a lack of coherence and a number of contradictions, although few are as blatant as this example from the energy section of the productivity document:

I'm pretty sure one of these isn't going to get done

I’m pretty sure one of these isn’t going to get done

or the proposal to double the proportion of disadvantaged students entering university. That sounds great, until you realise this is the government that tripled tuition fees, removed Education Maintenance Allowance that supported 16-18 year olds in study prior to university, and is removing maintenance grants aimed at the poorest students only to replace them with more loans.

An overriding theme throughout all of these speeches and documents is that of monetary value being the only measure of importance. Johnson says that only half of students polled thought that their course had provided good value for money[1], but a huge amount hangs around how we choose to define value. Is it simply a business measure of return on investment – the improvement in our salaries for the cost incurred? Is it that our path to a ‘good’ job (another loaded word) is eased? Or is it the knowledge that we were exposed to, our lecturer’s enthusiasm for their specialism that inspired us to change direction? Or simply watching the sun come up with friends after the final summer ball with that bittersweet mix of relief at having succeeded and regret that our time is ending? Do we measure ‘value’ in the ache of intellectual exertion and growth or in the frame we hang on the wall afterwards? I remember my eldest daughter wanting help with her English essays (i.e. ‘tell me what to write’) and us having the same conversation a number of times that the homework was the research, analysis and synthesis of the raw material. The homework was the process and the piece of paper handed into the teacher was just the proof that you’d done it.

There is a direct link to earnings made[2] and the phrase ‘… enable education providers to assess their effectiveness in delivering positive labour market outcomes for their students’ appears so there is little doubt what definition of value is being used. It’s obvious no one actively involved in the process of education wrote this. Is this really how we want to gauge higher education, in “positive labour market outcomes”? Yes, we want our students to be successful in whatever field they choose, but that should naturally follow on from quality education anyway. Having those outcomes may be appropriate for vocational courses (of whatever level) where that’s an explicit objective of the course anyway. That’s not a dig at vocational education, by the way. We have a very biased attitude towards vocational education in the UK, seeing it as the poor relative of higher education and a refuge for those lacking the ability to do a degree. That’s profoundly wrong. We only have to look across the channel to Germany to see what a less prejudiced approach to vocational education can achieve for individuals and the society they are part of.

As part of the push towards transparency and ‘more informed choices’ elements of the US version of the National Student Survey (NSS) are to be piloted. This is good because the American survey is much more fit for purpose in terms of measuring what’s important for teaching and learning rather than the ‘customer satisfaction’ surveys we use in the UK, but it does depend on how those elements are integrated with the current NSS. Jo Johnson’s speech talks about using these elements to measure ‘learning gain’. My big fear here is that the metric we use is an easy-to-measure proxy rather than a true representation of the thing we’re interested in. The speech defines learning gain as ‘the improvement in knowledge, skills and work-readiness’. Leaving the issue of work-readiness to later, these are all graduate properties that are emergent and as such at this level will be relatively difficult to measure with reliability and validity. What this will mean, as has been the case with the ‘value-added’ methodology in schools, is a push towards a proxy that may be only loosely representative of the true quality we’re trying to measure.

Another element to this danger of proxy worship is the next paragraph in the speech which, while acknowledging that “independent learning is vital”, then states that universities should be more transparent about how student time is split between lectures, seminars and tutorials, as well as who is doing the teaching. This information is valuable, but is not the whole story. I’d certainly welcome information on who is doing the teaching being more available, even if only to avoid the explosion in the use of adjuncts that has happened in the USA. Contact hours, however spent, will vary according to discipline, with STEM subjects typically having higher contact hours than the humanities, and again I can see no issue with this information being available in principle. The issue is that without some more qualitative metric to counterbalance them these numerical measures will distort how higher education is provided. Independent study will be sidelined in favour of contact hours since that will be the measure that importance is attached to, but how are those contact hours to be delivered, and by whom? Staff time (already stretched) costs money and student numbers are increasing, so if there are to be no additional resources provided and we can’t (and shouldn’t) reduce costs by using adjuncts or post-graduates to do the teaching, how on earth is it all expected to come together in some sort of coherent whole?

There is a worrying mention of the use of competition to drive up standards. It’s worrying in two ways. First, the practice of education is a collegiate activity and we succeed, as Newton put it, by “standing on the shoulders of giants”. Secondly, the productivity plan[3] makes clear what form this will take place by saying “widening the range of high quality higher education providers” and “remov[ing] barriers preventing alternative providers from entering and growing in the market”. To me, this sounds very much like fast-tracking a large-scale expansion of the for-profit sector in UK higher education. Given the current high standing with which UK higher education is held and widespread concerns over some of the for-profit colleges in the United States this seems a very risky strategy to pursue.

The productivity plan then goes on to say the government “will explore options to allow the best providers to offer degrees independently of existing institutions before they obtain degree awarding powers”[4]. I’m a little confused by the inclusion of this sentence. Courses can be already taken at institutions that don’t have their own degree-awarding powers provided that they are accredited by an institution that does – my own post-graduate teaching qualification was taken at an further education college but validated by a university – so why the need to ‘explore options’? Also, how is ‘best’ to be measured, and by whom?

The Jo Johnson speech mentions ‘innovation in terms of course length and design’[5], with an explicit mention of degree apprenticeships. This is a welcome acknowledgement of the importance of vocational education. Unfortunately, Johnson also mentions two-year courses on the grounds that they offer a more accessible route to higher education and, together with degree apprenticeships, offer a ‘faster route to productive employment’. I think it’s much more likely that accessibility to higher education is more adversely affected by the level of debt students will have on graduation rather than the length of the course. And why should a faster route to employment even be a goal? What evidence is there that a shorter course would produce graduates with comparable skills and attributes to those that graduate after three years?

Two-year courses would be attractive to those new for-profit providers since they can produce more graduates than a conventional university in the same time, particularly if the Teaching Excellence Framework allows some institutions to self-certify their level of performance (as has been done in schools where those that received the higher grades on inspection were re-inspected on a longer timescale and effectively inspected themselves in the intervening period). Together with the uncertainty around the degree-awarding powers for new providers these ‘more accessible’ pathways to HE and shorter routes to employment seem to be a recipe for dumbing down, slipping standards, and increasing ‘shareholder value’.

Johnson also talks about course choice and curriculum design[6], saying that not enough is being done to ensure graduates are prepared for work, and quotes a CBI/Pearson Education and Skills survey that nearly half of employers (47%) felt that universities weren’t doing enough to make graduates job-ready. Well, that would depend on how you chose to define ‘prepared’ and ‘job-ready’. My own response to that 47% of employers is: do your own training. We’re not your HR department. Graduates should have graduate-level, transferable skills – that’s the contribution from higher education to being job-ready. That means graduates can adapt to the specifics of a particular role or industry, but it’s the employer’s job to mediate and support that adaptation. If business has any evidence that we’re not producing that standard of graduate (beyond vague complaints that graduates are not ‘job-ready’) then they should produce it.

Johnson then says that businesses should not just be customers of universities, but “active partners”, and says that business outreach should be a core function with influence over curriculum design. Absolutely not – I repeat, universities are not part of a business’ HR department. Education is not the same as job training. Should businesses have some involvement in curriculum design? Yes, of course – collaborations with industry can be very productive for both sides – but decisions around the curriculum should rest with the university except in rare cases.

I’m not anti-business – trade and enterprise have always been a part of human societies and business is integral to modern societies – but I am against the fetishistic worship of business and entrepreneurs as having all answers to all questions. Increasingly, mainstream economics and politics seem to revolve around the mantra ‘the answer is a free-market. Now, what was the question?’ although there are others such as Naomi Klein and Paul Mason putting forward alternative viewpoints. Education has huge societal value beyond servicing the needs of business, but this seems to be increasingly neglected. A telling point is that higher education in the UK is administered not from the Department of Education, but from the Department of Business, Innovation and Skills.

Overall, the direction of travel for higher education in the UK does not look good. Statements and aims often explicitly contradict each other, such as wanting to widen access while simultaneously constructing more disincentives. The language of business dominates with the focus and metrics primarily targeted towards financial measures rather than anything innate in the process and practice of education. These are not the characteristics of a healthy higher education system, unless the function of that system is to be a subsidiary of business. These are not the characteristics of a system that Johnson himself acknowledges is a “world leader in higher education … and as number one in the world for the impact of our research”.

footnotes

1Johnson – Meeting value for money expectations.
2Johnson – More informed choices.
3Productivity plan – section 4.10
4Productivity plan – sections 4.9 and 4.10
5Johnson – Widening Participation.
6Johnson – Course choice and curriculum design.

Fall seven times, stand up eight

Recently I attended my university’s Teaching and Learning Conference where the theme was on employer engagement: “Beyond the Placement: Where Next?”. The conference didn’t start with the usual long keynote speech from a single speaker, but was more of a joint effort with four speakers giving their perspectives on the theme. First was Professor Carol Costley from Middlesex University talking from the perspective of the academic as researcher, followed by Professor Richard Sandell from the School of Museum Studies here at Leicester, who spoke about how curriculum design could be used to increase the range and diversity of contact between students and employers. The third speaker was Jennifer Williams from Teach First who spoke about the core competencies and values they looked for in their graduate recruits, and the fourth speaker was Dabean Faraj, a medical student, who gave an excellent and humorous presentation that brought the differing strands together from the perspective of a student.

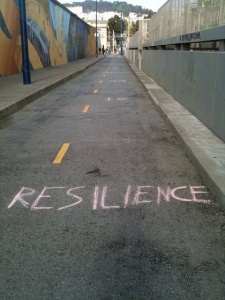
Resilience chalked on road

Photo: miz_ginevra (CC BY 2.0)

The keynotes over we departed to various parallel sessions before coming together later for discussions. The discussion highlighted the difference (and potential conflict of interest) between education and training, and as one of my colleagues put it we were veering “dangerously close to discussing the purpose of a university.” I’m firmly in the education in its widest sense camp rather than education as training. That’s not to say that employers shouldn’t be involved just that that involvement needs to be carefully considered. Employers can bring a great deal to the table, but their power needs to be kept in check. Unfortunately, a recent speech by our new Minister of State for Universities and Science, Jo Johnson, seems to be indicating a different agenda “Businesses should not just be seen as customers of universities … but as active partners”. A lot depends on that definition of ‘partner’, but that’s the subject for another post.

Jennifer Williams mentioned that resilience was one of the core competencies that applicants tended to score lower on. So what do we mean by ‘resilience’? One of the other attendees described it as ‘bouncebackability’, the ability to pursue a goal or objective with flexibility and determination in spite of difficulties and setbacks along the way. It’s a small part of a person’s personality but one that can have a big effect.

So how do we develop it? One suggestion was for failure to be a low cost option, with an opportunity to succeed afterwards. This may happen, and our response to it in conjunction with our students can help them to become more resilient, but how could we possibly design for that? Are we really going to deliberately engineer situations that will cause our students to fail in order that we can teach them to be resilient?

An alternative, with apologies to Vygotsky, is to use the ‘zone of proximal discomfort’. We learn resilience not in the act of failing, but in our response to it, in the act of striving to overcome those challenges that we think are beyond us. In the words of Tennyson, “ … To strive, to seek, to find, and not to yield.” An example of this is military training where a recruit is taken out of their mental and physical comfort zone, but not beyond their ability (although they might not think so, particularly in the case of the military where it’s less stepping outside the comfort zone and more of an emigration). The end result is an increase in confidence, ability and the resilience and character to go forward when all your senses are telling you to take cover instead. Schools are increasingly starting to recognise the value of resilience as part of the focus on character education, precisely because of the impact it can have on learning and the students’ lives as a whole. Which of course brings us back full circle: education as a holistic practice, not job training.

Striving for a personal best – who judges?

In this post I’m going to look at some of the issues surrounding a form of assessment you’re probably familiar with, but not with the terminology that goes with it: ipsative assessment. So what is ipsative assessment? It’s a means of assessment that measures the student’s progress, not by comparing to some external (and often arbitrary) standard, but by comparing the student’s achievement now to their achievement in the past. It asks the questions: Did I improve? By how much? It avoids the questions: What mark did I get? Did Fred do better than me?

This shift from external validation to internal comparison is an important one, and has a number of implications. Firstly, when done well it moves the focus towards personal growth and development. This, to me, is what education should be about. Arguably it’s the only measure that really matters long term, although the secondary effects of gaining qualifications and meaningful employment are also important. Education in this sense vastly exceeds the education-as-job-training model, developing citizenship as well as knowledge. My model of education always reminds me of a line from the film Dances with Wolves, when Kicking Bear (Grahame Greene) is talking to John Dunbar (Kevin Costner): “I was just thinking that of all the trails in this life there is one that matters most. It is the trail of a true human being. I think you are on this trail and it is good to see.” This idea is not new and goes back to Ancient Greece, where the responsibilities of citizenship were deeply connected to everyday life.

coaching word cloud

Coaching word cloud

Ipsative assessment in widespread in sports, and is often practised in conjunction with a coach – it’s the process behind the concept of a ‘personal best’, where achieving a personal best is a cause for celebration regardless of the result compared to others. I have my own boat (a GP14) and sail at a local club. It’s not a competitive boat. That’s not an excuse – the boat was built in 1973 and still has the same sails (which were old then) as when I bought the boat around 2000, so I’m not going to be winning any club races, even if I were a better sailor 🙂 . But it doesn’t matter: what matters is did I have a good race? How well did I spot the wind shifts? How well did I round the marks? In short, how am I sailing in this race compared to my own skills? Which, of course, is the only thing I can actually control. In this way, ipsative assessment is ‘performance in practice’, and as such is a prime example of authentic assessment.

The school system here in the UK uses a measure called ‘value-added’, which looks at the change in scores between various stages of schooling, with examination or test scores being the primary accountability measure. The downside is that if this measure is used to judge schools rather than record their performance then there will be pressure to game the system, which means that value-added isn’t measuring what it’s supposed to. In addition, I recall reading a blog recently where a teacher was criticising value-added because it assumed that the class that were tested in year 6 contained the same children that were tested in year 1. Their particular school had a high turnover of children because of local circumstances so the assumption didn’t hold. How on earth can you measure progress without tying the data to an individual? Surely without that link value-added has no value at all?

What I like about ipsative assessment is that the attention is focused on what has been achieved rather than what has not. It also gives us an additional chance to engage learners with taking responsibility for their own learning and that’s crucial for ipsative assessment to be effective, although achieving it can be problematic. When my daughter was taking her degree each assignment had a self-assessment sheet that was a copy of the one used by the tutors. The students were supposed to judge their own performance and then compare it to the tutor’s sheet when the work was returned. My daughter, despite many conversations about why self-evaluation was useful and what the educational purpose was, would simply tick the middle box all the way down. In effect, she deferred to an external authority to judge her work.

Conceptually, there is also a link to assessment for learning (A4L). While A4L allows the teacher to gauge student knowledge it can also be seen as ipsative assessment for the teacher that then feeds into their reflective practice.

A key question is how can we formalise ipsative assessment without losing the ethos behind it? We need structures and procedures to mediate and support the process, but the last thing education needs (especially schools-based education in the UK) is another accountability stick with which to beat the teachers. Firstly, if the process is simply a tick-box exercise then it’s not being allocated the importance it needs, and neither student nor teacher will take it seriously. Secondly, it’s vital that the process is student-owned. The student must be taking part in an active way with evaluating and processing their ipsative feedback for them to get the gains it offers. As Hughes has pointed out, the student needs to be the main participant, not the teacher.

In a previous post I described Jeremy Levesley’s approach to assessment, and this could fit quite nicely with ipsative assessment. Suppose we use Prof. Levesley’s approach so that we’re getting to a mark or grade quickly and then use the freed time to put more effort into the ipsative process? We get a mark to meet our accreditation needs (and those students who will still fixate on the mark above all else), and we get to develop learner independence and the self-assessment capabilities of our students. It seems like a win-win, but would a hybrid approach work, or are we just contaminating the ipsative process? I believe it could be done if the academic systems we choose to adopt within our course reinforces the practices we wish to see in our students.

The reason I think ipsative assessment isn’t more prominent in education at the moment is the relentless focus on education (and students) as a product, rather than education as a process, as Cory Doctorow recently observed in his wide-ranging video on openness, privacy and trust in education. And that’s the wrong focus. Why train students to perform in systems that are so unrepresentative of the world beyond the campus when we could teach them to judge themselves and extend beyond their personal best?

Assessment: it’s a variable not a constant

The second post in this short series is going to be about assessment in general. How reliable is it? What are we actually trying to measure? Are we more concerned with how we measure rather than what we measure?"Assessment" You keep using that word. I do not think it means what you think it means

Reliability (assessing consistently), and validity (correctly assessing the thing we want to assess) are key concepts in assessment, but how well are we achieving these aims in practice? We pretend that assessment and marking is an objective, repeatable process, but like much of the rest of education, it’s messier and more untidy than that.

Tom Sherrington, points out that marks aren’t uniform in size. Some marks are easier and some harder to achieve so that everyone has a chance to demonstrate their learning. We can also use ‘harder’ marks to distinguish between grades, as was the case with Hannah’s sweets in a previous post. The aggregate scores are also not directly comparable. If two students have a score of 36 out of 50 then this implies equal achievement and level of knowledge but this may not be the case when we take into account where within the assessment those marks came from. If that’s the case when we’re talking about a science exam, then when it comes to more essay-based disciplines is it any surprise that “there is no correct score for an essay?”. And if you think marking is variable at school, then marking in higher education may come as a shock.

There is a big difference between assessment of learning (summative) and assessment for learning (formative), and as I mentioned in the first post in this series we tend to ignore the formative in favour of the summative. Interestingly, assessments often try to combine the two, which then begs the question: are we doing either well? Assessment is typically summative, with some feedback included in the hope that it ‘feeds forward’. The downside is that from the perspective of the student the point at which that feedback would be useful has already passed because they see this assessment as having ended – they focus on the mark since that tells them ‘how they did’. The feedback isn’t really assessment for learning, but rather an explanation of the assessment of learning, with an few added implications for future practice.

Jeremy Levesley recently gave a presentation describing his approach to assessment in a third year mathematics module. His aim is to spend as much time as possible in communication initiated by students, and to engineer situations in which that is promoted. Different assessment activities are targeted to the grade boundaries so that, for example, the question ‘is this first-class work?’ can be answered yes/no/maybe. Basic skills tests decide pass or fail, unseen exam questions decide 2i or 2ii, and student topic work decides whether the work is first-class or not. I really like this approach because it’s an example of how assessment can straddle both the formative and summative assessment camps. Because the conversations are student-initiated they can serve as assessment for learning, involving students in taking responsibility for managing their own learning. The summative nature of the assessment explicitly recognises the inherent variability in marking, and takes advantage of it by targeting it to a single answer (yes/no/maybe). This gives a corresponding reduction in workload for the tutor, freeing up time to be used more productively elsewhere.

Assessment can be misused. There can be a change of emphasis towards what can be measured relatively easily rather than what is valuable. For example, character education is an emerging area in UK school education and I can see its value (provided that by character we don’t mean conformity), but should we be ‘measuring’ it? This emphasis on measurement has two impacts. First, the valuable (but difficult to measure) gets replaced with some easier to measure proxy, so character might be measured by how many days students are involved in community volunteering. Secondly, the proxy becomes the measurement. Originally, SATs were supposed to sample student knowledge and skills at a particular point in time. What has happened is that SATs have come to dominate teaching activities as the scores have become the means by which schools are deemed to be failing or succeeding. What started as a useful benchmark has become an accountability stick with which to beat schools and teachers. Also, the pseudo-statistical judgements made about school performance are highly dubious if we’re looking for robust and valid measurements, as the Icing on the Cake blog frequently documents.

I love Carol Dweck’s work on mindset. Judgements of a student (whether from inside a school or outside) have a significant effect on student achievement because students can see themselves as failing in comparison to others, or failing because the school is failing, but this ignores the internal achievement that may be occurring. A runner may come, say, 439th in a marathon, but might have knocked ten minutes off their previous best time. They didn’t win the race, but their performance was the best of their life, so how can that be judged as a ‘failure’?
A policy being floated at the moment here in the UK is that of ‘secondary readiness’. Students take SATs at the end of key stage two (age 11). Previously, their scores would have been recorded and passed to their secondary (high) school, but the proposal now is to introduce the idea of ‘failing’ these tests. If the scores aren’t high enough then they are to retake them. This has the potential for children to be labelled (by themselves or others) as failures at a time of major social upheaval (the move to secondary school) and just before they hit puberty. Now, what could possibly go wrong with that? 🙂

I understand the need for accountability and having commonly understood standards of achievement, but the greatest educational impacts are not those projected outwards, but those reflected inwards. We like to know how we’re doing in relation to others, but more importantly how we’re doing in relation to our own ‘personal best’. That’s the subject for the next post.

Hannah got the sweets, who got indigestion?

Last Thursday in the UK around half a million 15 and 16-year olds took a GCSE maths exam, specifically the second paper in the non-calculator exam. By Friday the exam was trending on twitter (#EdexcelMaths), with one particular question attracting attention:

There are n sweets in a bag.
6 of the sweets are orange.
The rest of the sweets are yellow.

Hannah takes at random a sweet from the bag.
She eats the sweet.

Hannah then takes at random another sweet from the bag.
She eats the sweet.

The probability that Hannah eats two orange sweets is 1/3.

(a) Show that n2 – n – 90 = 0

I had a quick attempt and after one unproductive sidetrack I got the answer. So why am I writing about this? Because it fits in with the other posts on assessment I’m doing, and to explore some of the issues around it.

First, the actual  mathematical content is pretty straightforward – you only need to know how to do three things: calculate a probability without replacement, multiply fractions and rearrange an equation. This is hardly Sheldon Cooper territory.

The exam board has two tiers for the qualification (foundation and higher) and probability without replacement is only explicitly mentioned for the higher tier. The exam has been quoted as saying the question was aimed at those students who would achieve the highest grades (A and A*), and I think grade discrimination is a fair approach. I did ask my daughter (who’s currently revising and taking A-level maths) and she said she wasn’t sure she would have been able to answer it at 16. For non-UK readers, GCSE exams are taken at the end of compulsory schooling and A-levels are taken at 18, typically as a route to studying at university.

So why my unease with students finding it difficult? There’s always the charge of dumbing down levelled at exams but I don’t think that’s it. True, when I did my maths exam at that age the syllabus included calculus of polynomials and their applications, which now is only introduced at A-level, but they were different qualifications – GCSEs were only introduced after my school career had ended. I think my unease comes from the fact that I think this shouldn’t have been seen as a difficult question. Donald Clark has blogged seven reasons why he agrees with the children and thinks it wasn’t a fair question, some of which I agree with and most that I don’t.

There’s a couple of factors involved here. I recall reading a study where they looked at who could answer questions with the same maths content but that were written in different ways. That study found that questions written as word questions rather than equations were consistently harder to answer, even though there was no difference in the actual mathematical content. Secondly, I think it’s the way that maths is taught as rules and recipes to follow rather than a creative problem solving activity. This is not a criticism of the teachers because I think that it’s taught that way precisely because of the pressures that have (politically) been placed on education. As I’ve mentioned before I’m a big fan of Jo Boaler’s approach and it’s emphasis on flexibility and application of technique rather than stamp-collecting formulae. Donald Clark makes the distinction between functional maths (maths for a practical purpose such as employment) and the type of maths typically found in exams, but I think that’s a false dichotomy in this case. As Stephen Downes said “… what this question tells me is the difference between learning some mathematics and thinking mathematically.”. The difference between functional and theoretical maths (at this level) starts to disappear when we think mathematically – maths becomes a toolbox of skills to be applied to the problem at hand, rather than a particular formula in a particular topic to be remembered.

And if you’re wondering what the answer was:

The solution to Hannah's sweets

The solution

Assessment – where are we? Where are we going?

Assessment has become something of a theme in the things I’ve been involved in over the past few months, so this is the first of a series of posts on the topic.
I’ve just completed the ‘Assessment for Learning in STEM Teaching‘ MOOC on Futurelearn by the University of Leeds. It was a little outside my normal area in that it was focused more towards learning in schools, but I was looking for general principles and any crossover with higher education. Lately, I’ve found myself subscribing to more blogs that are specifically to do with the schools sector. Partly this is due to my interest in politics and the impact of the recent (May 2015) general election in the UK on the education system as a whole, and partly because of a personal project I’m developing (ourcommonoceans.info).

Keep calm and assess formatively

Keep calm and assess formatively

The key starting point for the MOOC was a review of an influential paper ‘Inside the black box: raising standards through classroom assessment‘ by Paul Black and Dylan Wiliam. The paper looked at the evidence for the effect of formative assessment within the classroom on student achievement. According to Google scholar this paper has been cited over 4500 times, and Dylan was one of the educators on the course.

Formative assessment is important – it makes a significant difference to student outcomes, but it’s the bit that’s often missed, the bit students don’t really see the point of. For many students, formative equals optional, and optional means not required. But if you were to suggest that someone was to learn to drive by skipping the lessons and just taking the test again and again, they’d think you were mad, but that’s precisely what happens when formative assessment isn’t done by students or made available by staff. The term ‘formative assessment’ itself can mean different things to different people, so let’s narrow down what we’re talking about in the context of the course.

Here we’re talking about formative assessment ‘within the classroom’. This isn’t formative assessment as practice preceding a summative assignment, or to (primarily) tell the students how they are doing. Instead, what assessment for learning means is that part-way through a session the teacher takes some action to gauge what the current understanding of the students is, where the misconceptions are, and crucially, what action needs to be taken next. It’s the educational equivalent of orienteering – find where you are, look at your next destination, plan the route and move.
The course talked about intentional dialogue – the planned process of exploring understanding – and differentiated between facilitated discussions and hinge-point questions. These hinge-point questions are carefully crafted multiple choice questions where the answers map to common misunderstandings. Follow-up questions to particular students about why they answered the way they did meant the teacher could confirm they got the right answer for the right reason or explore the reasoning behind the wrong answer. Videos of teachers in action in the classroom bridged the gap between theory and practice, as well as giving us the chance to analyse and critique the technique. Intentional dialogue reminded me a lot of Laurillard’s conversational framework, although in this case the conversations are face-to-face and not mediated by technology.

Assessment for learning is a significant factor in raising achievement. If we want students to engage with formative assessment (in all its forms) then we need to design our courses so that formative assessment is what is emphasized and rewarded. As Jen Ebbeler says “by incentivizing practice, we are actually incentivizing the type of behaviour that leads to learning”. What should happen is that teachers have authority over their professional practice and decide how and when to use it. I have heard anecdotally that in some areas it has become an additional accountability measure i.e. teachers now not only have to use it, but need to be able to prove that they’ve used it. Perhaps if we want educational results to rival those of the Scandinavian countries it might be better if we took on board some of their methods, (see the taught by Finland blog for a comparison) such as giving teachers the trust and autonomy to simply do their jobs.

So what does assessment for learning look like in higher education? I’d argue it’s much less common outside the seminar room simply because of the scale, particularly with my department’s first year cohort now substantially into three figures. We might also assume where it is present it bears little resemblance to assessment for learning in schools, but does it? In school, students might hold up a coloured card with a big letter A. At university we might use polling tools such as Turningpoint, and if we want to go low-tech, then Keele communicubes have been around for a while now, courtesy of Dr Stephen Bostock. Are we really doing anything fundamentally different, apart from succumbing to ‘shiny toys’ syndrome and congratulating ourselves on how innovative we are?

Returning to the MOOC, did I find it useful? Yes. Would I recommend it to others? Yes, because I found it beneficial to look at learning from the perspective of school teaching. My only negative point is that I would have preferred to have had a class that I could have practised the technique with.

Times tables – a matter of life and death?

Recently I took my youngest daughter to visit a university in the north-east of the UK, which involved a round trip of nearly 500 miles and an overnight stay. There’s a general election due in less than three months, which means we’re into that ‘interesting’ phase of the electoral cycle where all the parties try to outcompete each other either with bribes incentives for certain groups (‘Unicorns for every five-year old!’) or to outdo themselves with demonising whatever group is the scapegoat this month. If you’ve ever seen the Monty Python’s four Yorkshiremen sketch, you’ll know what I mean.

So what has this to do with times tables? Well, one of the announcements was for every child to know their times tables up to 12 by the time they leave primary school (i.e. by age 11), and by ‘know’ they appear to mean memorise.

I have a number of misgivings about this. Firstly rote learning without understanding isn’t particularly useful. Memorisation isn’t education. Secondly, as the work of Jo Boaler has remarked students perform much better at maths when they learn to interact more flexibly with maths (number sense) rather than than simply remembering the answers. As she points out, calculating when stressed works less well when relying on memory, which is presumably why politicians refuse to answer maths questions when interviewed, as Nicky Morgan the education secretary did recently. In one of my previous jobs I worked in a health sciences department and the statistics on drug errors (such as calculating dosages) were frightening, and there are few things less stressful than someone potentially dying if the answer to a maths problem is wrong.

The outcome of all this memorisation is that the application suffers. As we travelled back there was a radio phone-in quiz and as times-tables were in the news one of the questions was zero times eight. The caller answered eight, and was told they were wrong. A few minutes later someone else called to tell the presenter that they were wrong because zero times eight was eight, but eight times zero was zero. And this is the real problem. While maths is seen (and taught) as a recipe, a set of instructions to follow, misconceptions like this will continue to prosper. Personally, I see maths as more of a Lego set – a creative process where you combine different components in different ways to get to the end result you want. As Jo Boaler has said “When we emphasize memorization and testing in the name of fluency we are harming children, we are risking the future of our ever-quantitative society and we are threatening the discipline of mathematics”. Unfortunately, I’m doubtful whether that will count for anything against the one-upmanship in the closing months of an election campaign.

Playing with data in R

It’s coming up to that time of year again when the students get introduced to R> and the joys of the command line, which means that they can’t simply click and type a new value the way that they can when working with a spreadsheet.

R uses a variety of data types and one (data frames) has the familiar grid structure familiar from spreadsheets. I’m going to cover some of the ways we can manipulate data frames within R, and well as one of the ‘gotchas’ that can catch you out.

First of all, we need some data to play with.

sample_id <- c(1:20)
length <- c(rnorm(10, mean=22.1, sd=3), rnorm(10, mean=18.2, sd=3))
weight <- c(rnorm(10, mean=900, sd=125), rnorm(10, mean=700,sd=125)
site <- c(rep(1:2, each=5),rep(1:2, each=5))
sex <- c(rep("M", each=10), rep("F", each=10))
my_sample <- data.frame(sample_id, length, weight, site, sex)

The rnorm function selects data from a normal distribution, so the length line gives us ten samples around a mean of 22.1 with a standard deviation of 3 and ten samples around a mean of 18.2 also with a standard deviation of 3. The rep function is a quick way of entering repeating values. The result of all these commands is a data frame called my_sample, which we can examine by typing in the name:

my_sample
sample_id length weight site sex
1 1 23.09771 899.9570 1 M
2 2 19.51399 819.5591 1 M
3 3 21.79052 893.0299 1 M
4 4 24.84175 822.7836 1 M

There’s a number of ways we can look at a column. We can use the $ notation (my_sample$weight), which is my preferred method for referring to a single column. I tend not to use attach(my_sample) because if I have two data frames and the same variable name in both then things start to get confusing if both have been attached at the same time.
The second way is my_sample[, 3], which gives me the third column. Note that in R, indexing starts at one rather than at zero as is the case in many programming languages. This second notation has the form dataframe[row, col] and by leaving the row part blank R defaults to giving us all rows.
The third method (and my least favourite) is the double bracket method: my_sample[[3]]. Any of these three methods give exactly the same result.

If we want to look at rows we use the dataframe[row, col] notation but this time with the column part left blank, so for example

my_sample[4,]

gives us the fourth row and

my_sample[1:10,]

gives us the first ten rows.

This technique of selecting only particular rows or columns is called slicing and gives a lot of control over manipulating our data. What about if we want rows (or more likely) columns that aren’t next to each other in the data frame? The [row, col] format expects a single number (object) separated by commas. We can use the c() function to create a variable that contains more than one value:

my_sample[,c(2,3,5)] #gives us length, weight and sex columns.

and these slices can themselves be saved as data frames.

subset_of_sample <- my_sample[,c(2,3,5)]

Suppose I want all the male samples as one subset and all the females as another. Because the males and females are grouped within the data set I could use row slicing to do it:

female_sample <- my_sample[11:20,] #rows 11-20

but what if that wasn’t the case? We can use the value in the column to decide whether to select it.

males <- my_sample$sex == "M"
males

This gives a variable that is the same length as the column and consists only of false or true values depending on whether the value was “M” or not, and we can use this variable when we slice the data frame. The logical value means that we select the row if the value in ‘males‘ are ‘TRUE‘.

male_sample <- my_sample[males,]
head(male_sample) # head displays just the top few rows.
head(male_sample, 3) # or we can be specific about how many

We can look at a particular row and column using:

my_sample$weight[4]
my_sample[[3]][4] # third column (weight), fourth row

which is good if we suddenly discover from our lab notebook that this particular value is incorrect, because we can read a single value directly into that place without affecting the rest of the data frame.

my_sample$weight[4] <- 900.2154

The next stage is that I want to add the weight:length ratio to the data. I can calculate the values using the existing columns and then put the results into a new column that I create at the same time:

my_sample$ratio <- my_sample$weight / my_sample$length
head(my_sample)

I can also do the same thing if I need to change an existing column. Suppose I have multiple samples and I need to renumber the sample IDs to avoid confusion.

my_sample$sample_id <- my_sample$sample_id+100
head(my_sample)

Now I want to add some new data to the bottom of the data frame. First I’m going to add a row using a method that works, and then I’ll cover one of the surprises that R can spring on you.

mean(my_sample$length) # just testing
new_row <- list(121, 18.72391, 710.1846, 1, "F", 710.1846/18.72391)
my_sample <- rbind(my_sample, new_row)
mean(my_sample$length) # still works
tail(my_sample) # bottom few rows

The two lines doing the work here are the second and third. First I create the data for a new row using the list() function, and then use the rbind() function (which stands for row bind) to add it to the bottom of the data frame. The list() function is the critical part as we’ll see later. Now for the gotcha. I try to add a new row:

new_row2 <- c(122, 17.99321, 698.7815, 1, "F", 698.7815/17.99321)
my_sample <- rbind(my_sample,new_row2)

This time I’m using the c() function. It seems to have worked, but if I try to find the mean of my length column I get an error:

mean(my_sample$length) # gives error

So we might think we can remove the ‘bad’ row and have a rethink:

my_sample <- my_sample[1:21,]
mean(my_sample$length)

but that still doesn’t work. We then take a look at the row we added and find that R has converted the values to text.

new_row2
class(new_row2) # class tells what data type the variable is

That’s because the c() function needs data that’s all of the same type. R got around the problem by converting the other values into text without telling us, although we should at least be grateful it did the calculation for the ratio before the conversion. That’s called ‘type coercion’ by R or ‘casting’ by programmers, but why can’t we calculate the mean even though we’ve deleted the bad row?

str(my_sample)

See where it says ‘chr’? R wants all the values in a single column to be the same data type so it’s converted each of the columns to text as well. So that little ‘c’ in the second example of adding a row has had the effect of basically converting our entire data frame to text values rather than numbers. Depending on the size and importance of our data set that’s either an ‘oopsie’ or a moment of sheer blind panic. The good news is that we can switch it back.

my_sample$sample_id <- as.integer(my_sample$sample_id)
my_sample$length <- as.numeric(my_sample$length)
my_sample$weight <- as.numeric(my_sample$weight)
my_sample$site <- as.factor(my_sample$site)
my_sample$ratio <- as.numeric(my_sample$ratio)

These ‘as.type‘ functions convert from one data type to another (where possible), and can get us out of trouble if R does some type coercion in the background without us noticing. R has its quirks, but it’s a powerful package and well worth spending some time on if you need to move beyond basic statistics.

BYOD4L Day Four: Collaborating

The topic for day four of BYOD4L is collaboration. We were given two scenarios: one of a student finding it difficult to contribute to a group project because of other commitments, and one of a lecturer who wants to connect to other academics and give her students a wider exposure to the subject.

Collboration

Photo: Alan Cann (CC BY-NC-SA 2.0)

The student can’t make the meetings that are being arranged because they are are in the week and she works full time. I see this problem as having two parts – her need to take part in the meetings (discussion) and her need to share and access various project documents (resources). The obvious solution for discussion is to use asynchronous techniques, for example, a closed Google+ or Facebook group. However, synchronous techniques are also possible. She could see if an evening meeting could be arranged instead using a tool like Doodle.com to check availability. If she could argue that her course is of benefit to her employer she could ask for a degree of flexible working and either attend the weekday meetings face-to-face or via a Google hangout. The downside is that this requires a degree of self-confidence that she may not feel, particularly as she feels unable to ask her fellow students for a weekend meeting. Documents can be worked on collaboratively through Google docs, or shared through services such as Dropbox or Google drive.

Google hangouts are one area I would like to explore in my own practice. Despite being invited to many, their timing always seems to clash with something else. I’ve also taken part in many webinars although it’s arguable how ‘collaborative’ they are. A lot depends on the facilitator and the number of participants and their inputs.

Collaboration, I think, is a emergent property of the other activities (connecting and communicating) in a similar way to offline networking where you have to build a relationship and level of trust before you can work together.

BYOD4L Day Three – Curating

The topic for day three of #BYOD4L is curating, and I thought I’d reflect on it through considering my sources, my stores, my outputs and finish with other potential channels.

Sources

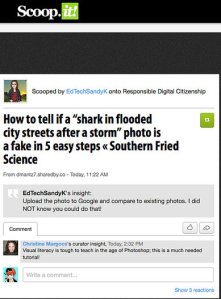
Scoop.it screenshot

Photo: info_grrl (CC BY-SA 2.0)

I use RSS feeds a lot, and currently have almost 450 feeds organised into thirteen categories, with around half of those feeds being directly related to work. The categories include work, web development and coding, personal, environment, journals and trial. I use Feedly  at the moment, although over the past couple of years I’ve tried quite a few readers. I used Google Reader, then moved to the Old Reader when Google shut their service down. Then I resurrected my old bloglines account, before finally moving to Feedly. So one of the important things for me about a reader is that it needs really good import and export facilities.

Twitter is another main source. I’m following nearly 1300 people on my @DuncanGreenhill account (in nine lists), plus a number who are on lists but not followed (as I explained in my day two reflection). My other account (@ourCommonOceans) has only been set up for about eight weeks and is following 135 people, many of whom were on the ‘Marine Issues’ list on my named account.

In Google+ I’ve circled around 1400 people in eighteen circles, and have a couple of other circles where I’m the only member. That seems strange, to circle yourself, but I have a ‘read later’ circle so that I can temporarily bookmark a post but keep it within the Google+ service.

In Facebook I’ve joined a number of groups concerned with marine conservation, including groups set up to help with identification. So what I have there is access to a group of very knowledgeable people that can identify organisms down to species level, which is an incredible learning opportunity for me (I live quite a distance from the sea so my ID skills are quite rusty).

My final source is email. I get some information from mailing lists, but I also get a lot of journal contents alerts through email.

Stores

I use Diigo for bookmarking, having migrated from delicious a couple of years ago. Although I did use the network features in Delicious, I tend not to use them in Diigo, but I couldn’t really give you a reason why. Perhaps because while bookmarks can be mobile, networks are much less so.

I use a wiki running on my PC to ‘store’ my notes and thoughts. There will be project documentation, course notes, notes I’ve made on reading particular papers, and many others. It’s an unusual approach, but one that works for me. It makes the process active – I have to physically collect and order my thoughts before I can enter them into the wiki. There is a time penalty to this, but I’ve found the advantages outweigh the benefits. In effect, it’s an external sum of knowledge, actively added to, searchable, and easily amended. I know some use blogs for the same purpose, but I prefer to have a more private space where I don’t want to worry about how it appears to others while I work through something.

And of course I use the usual network/local folders for document storage, and for citation management I use an open source Java application JabRef.

Outputs

My outputs are Twitter, Google+ and my two blogs. My named twitter account has over 600 followers and my marine account has 24. On Google+, I’m in the circles of 667 people. The blogs are relatively low traffic, although that’s improving. For this blog, I think that’s down to the frequency of posts, and for Our Common Oceans I think it’s down to only really becoming active with that blog over the last couple of months.

Other channels and final thoughts

I may consider more overtly curated outputs such as paper.li or scoop.it. Paper.li would need to be carefully used. I get quite a few paper.li notifications on Twitter and often they’re not focussed enough for me – there’s simply not enough signal to outweigh the noise. If I were to use it, I would have to take great care choosing and filtering my sources, and I’d probably steer away from a daily publication towards a weekly one. The aim would be to give decent content once a week, rather than a daily dose of (mostly) irrelevance. I’ve found that the scoop.its that I get via RSS feeds tend to be of a higher quality.

One thing that I’ve noticed from my posts over the past three days is that I categorise the bejebus out of everything – Twitter lists, Google circles, Feedly categories – mainly I think to create smaller contexts that I can switch between as and when I need to. It reminds my a lot of David Allen’s Getting Things Done, where the lists of next actions (to do list) is organised not by project but by context or location. And a final reflection for today – if information had calories, I think my health would be in serious trouble.